Jimmy Nguyen

Data Analyst & Business Analyst
Creating certainties out of uncertainties

View Portfolio

About Me

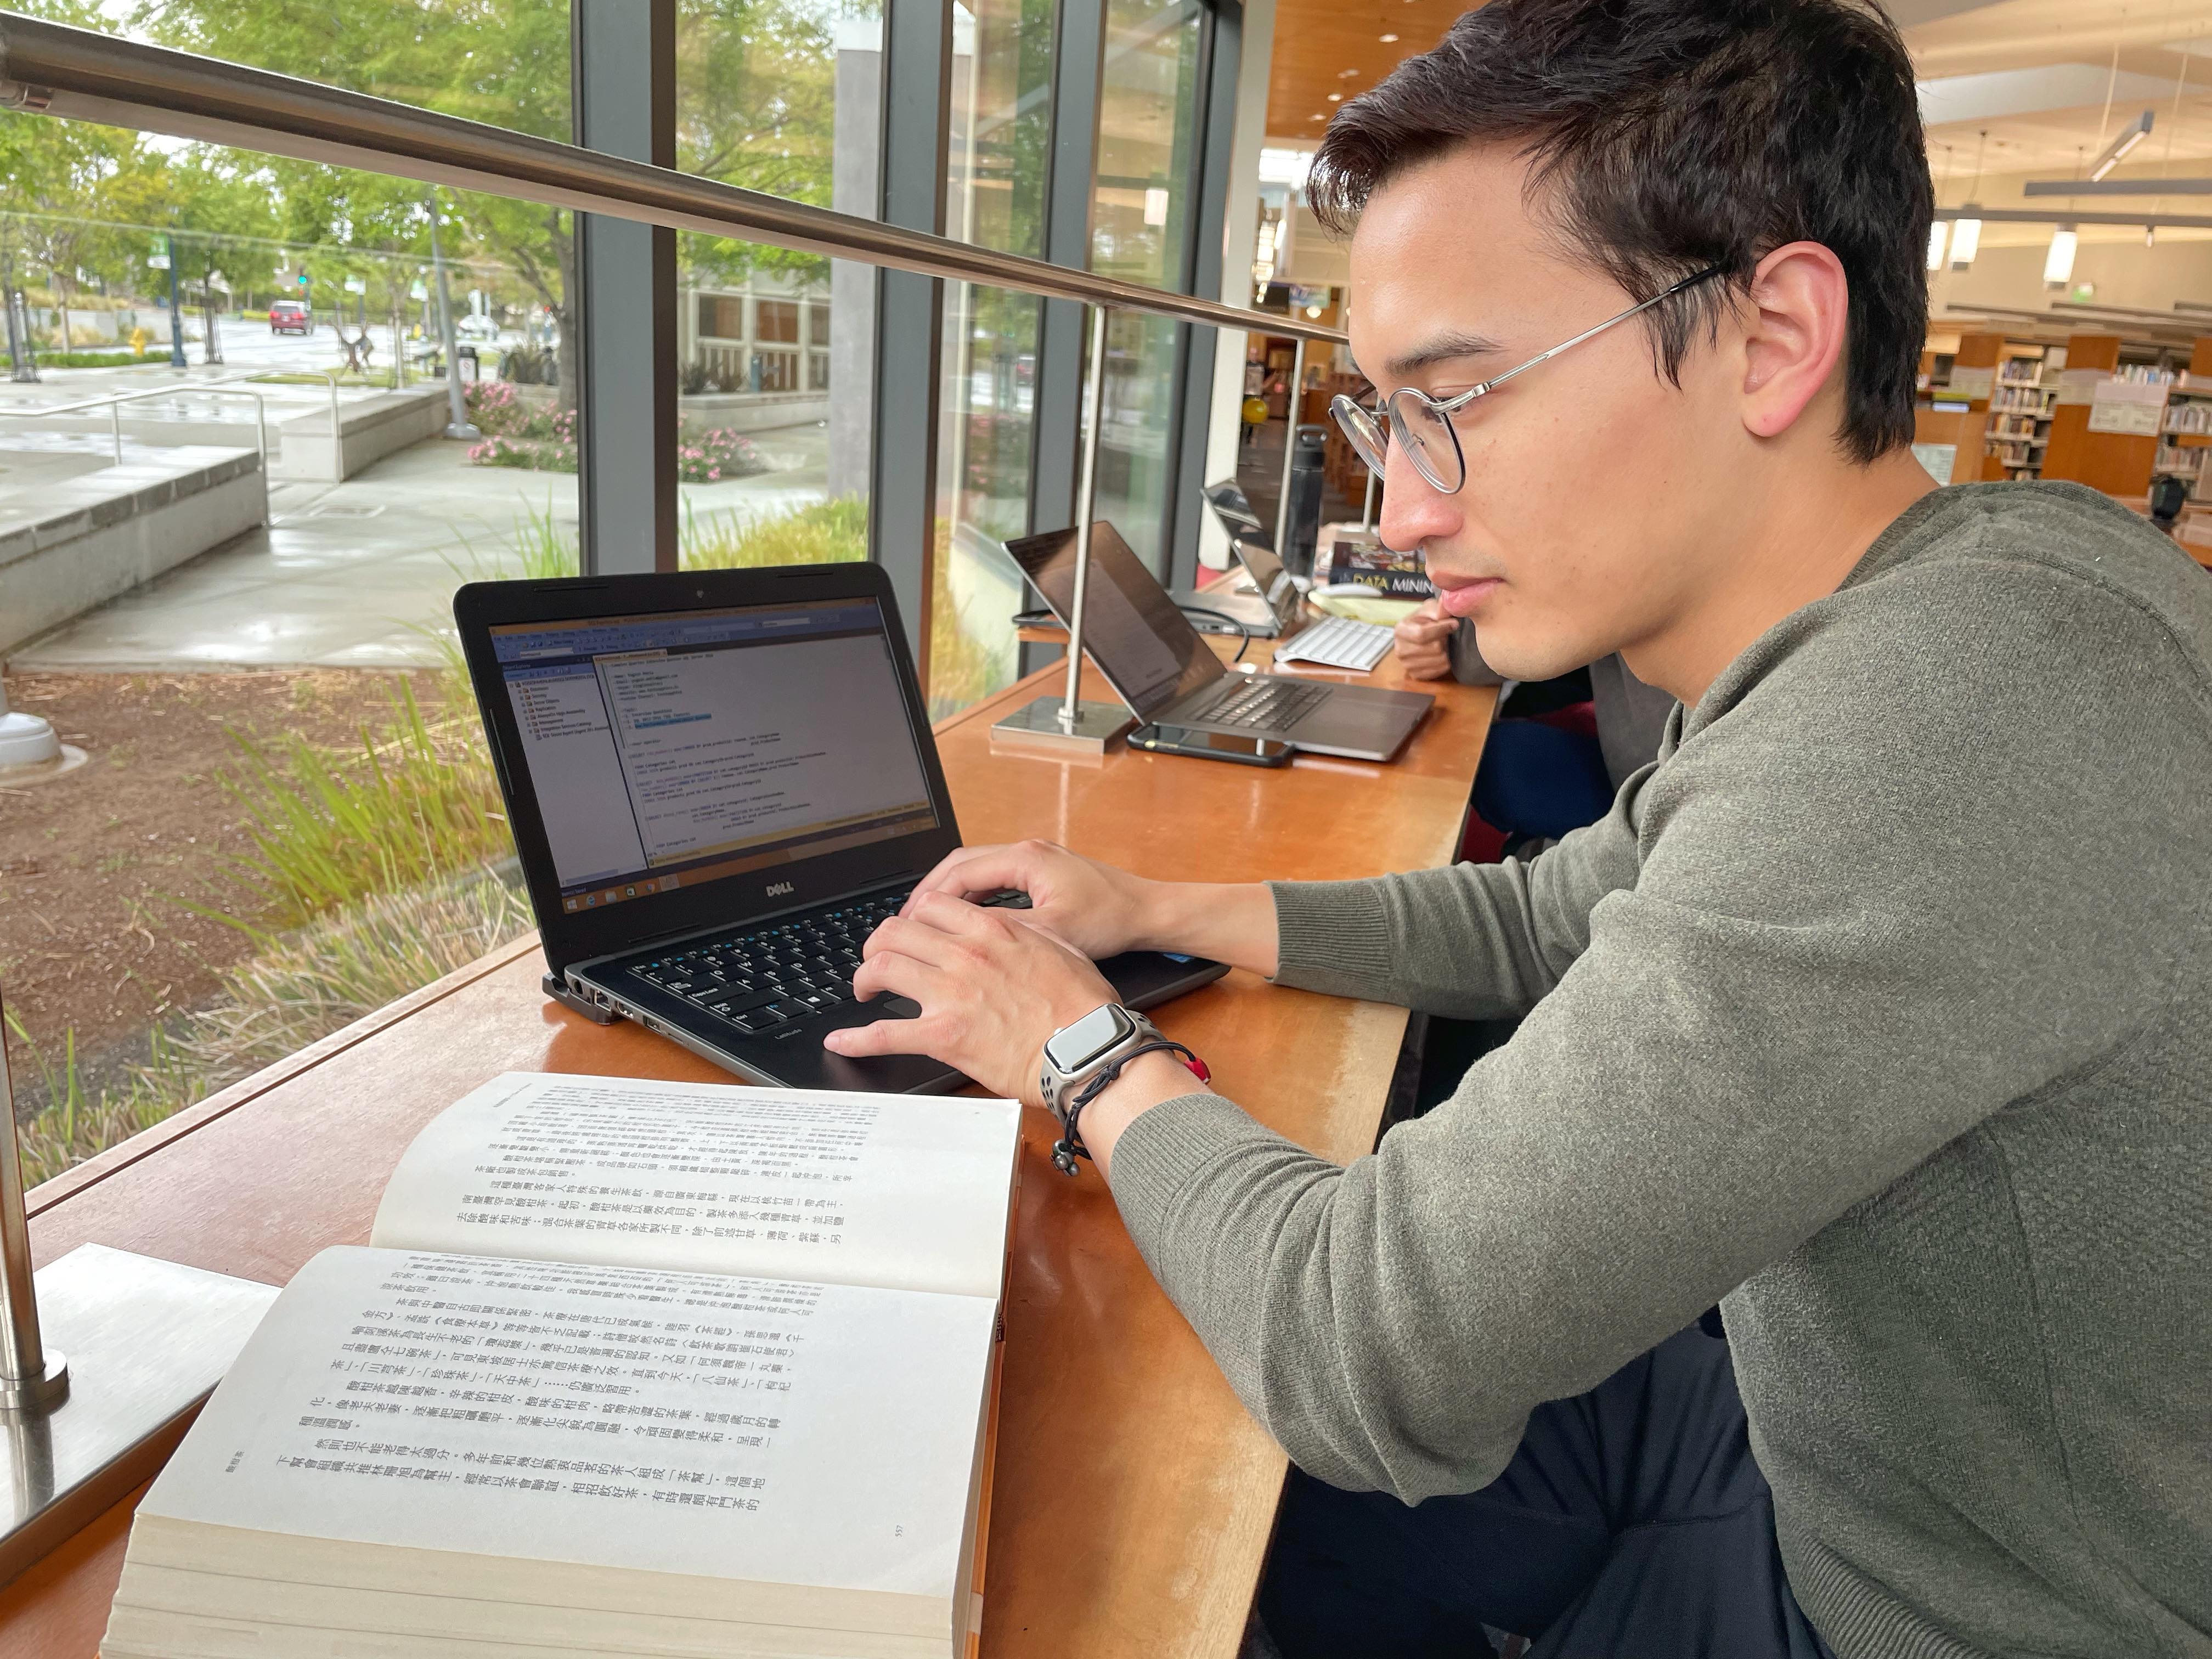
I am obsessed with data. I hold a degree in Business Data Analytics from Portland State University and have collaborated with Fortune 500 companies, including Amazon, Nike, and Intel, to drive business objectives through data analytics.

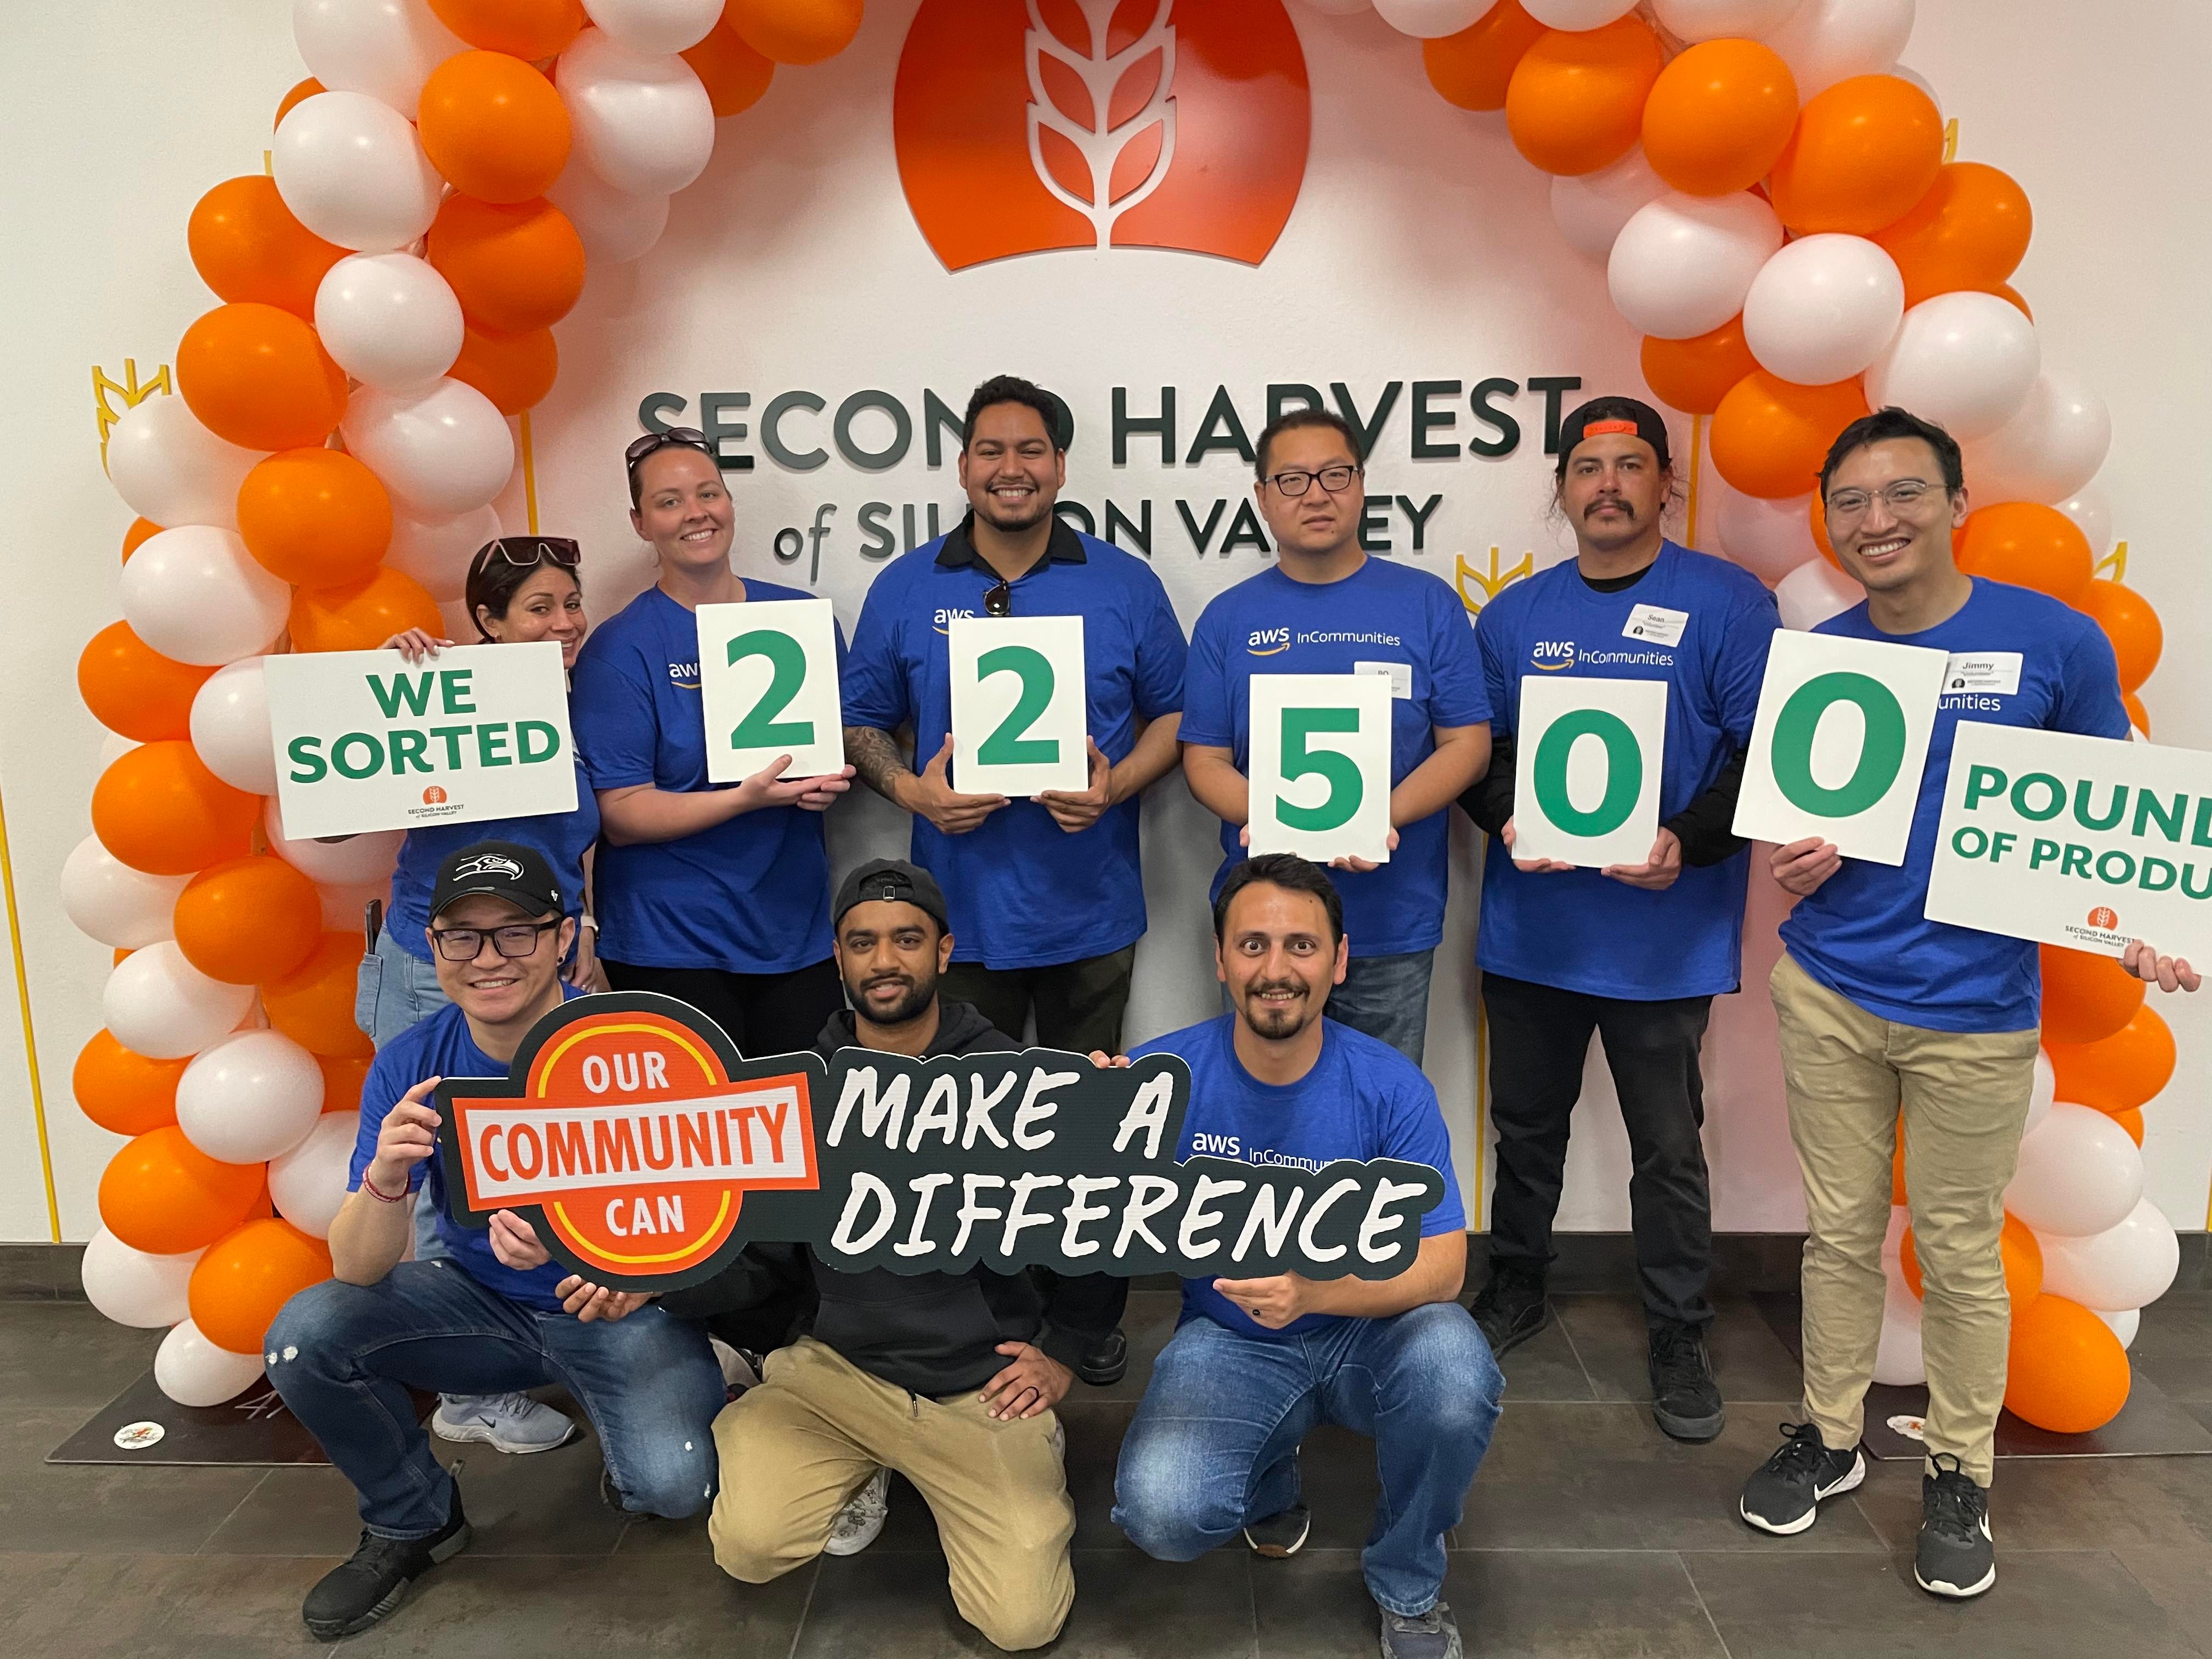
Beyond corporate experiences, I take pride in making a difference in the Bay Area community. At Second Harvest of Silicon Valley, I applied data visualization and UX design to streamline processes and provide actionable insights.

Contact: Jimmypn94@gmail.com

Jimmy Nguyen Profile

Technical Skills

Data Analysis

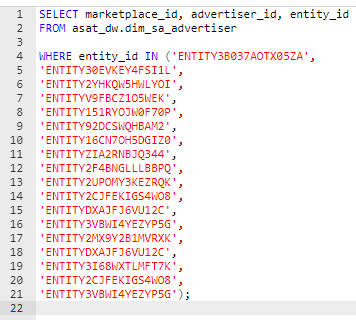
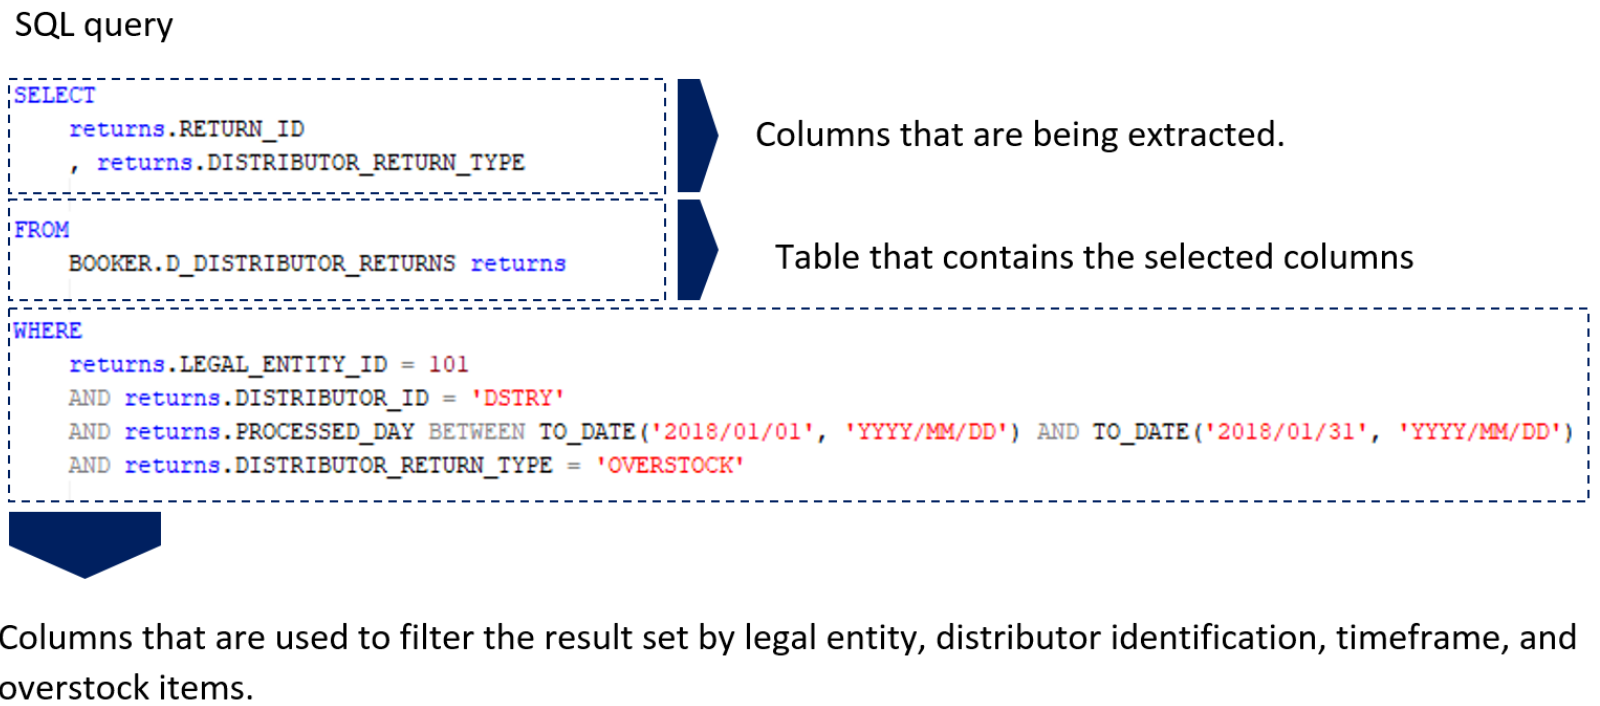
Analyzing data using SQL, Python, R, and Excel to identify patterns and correlations. I build predictive models and visual learning modules for deep metrics understanding.

SQL Analysis Data Modeling

Data Visualization

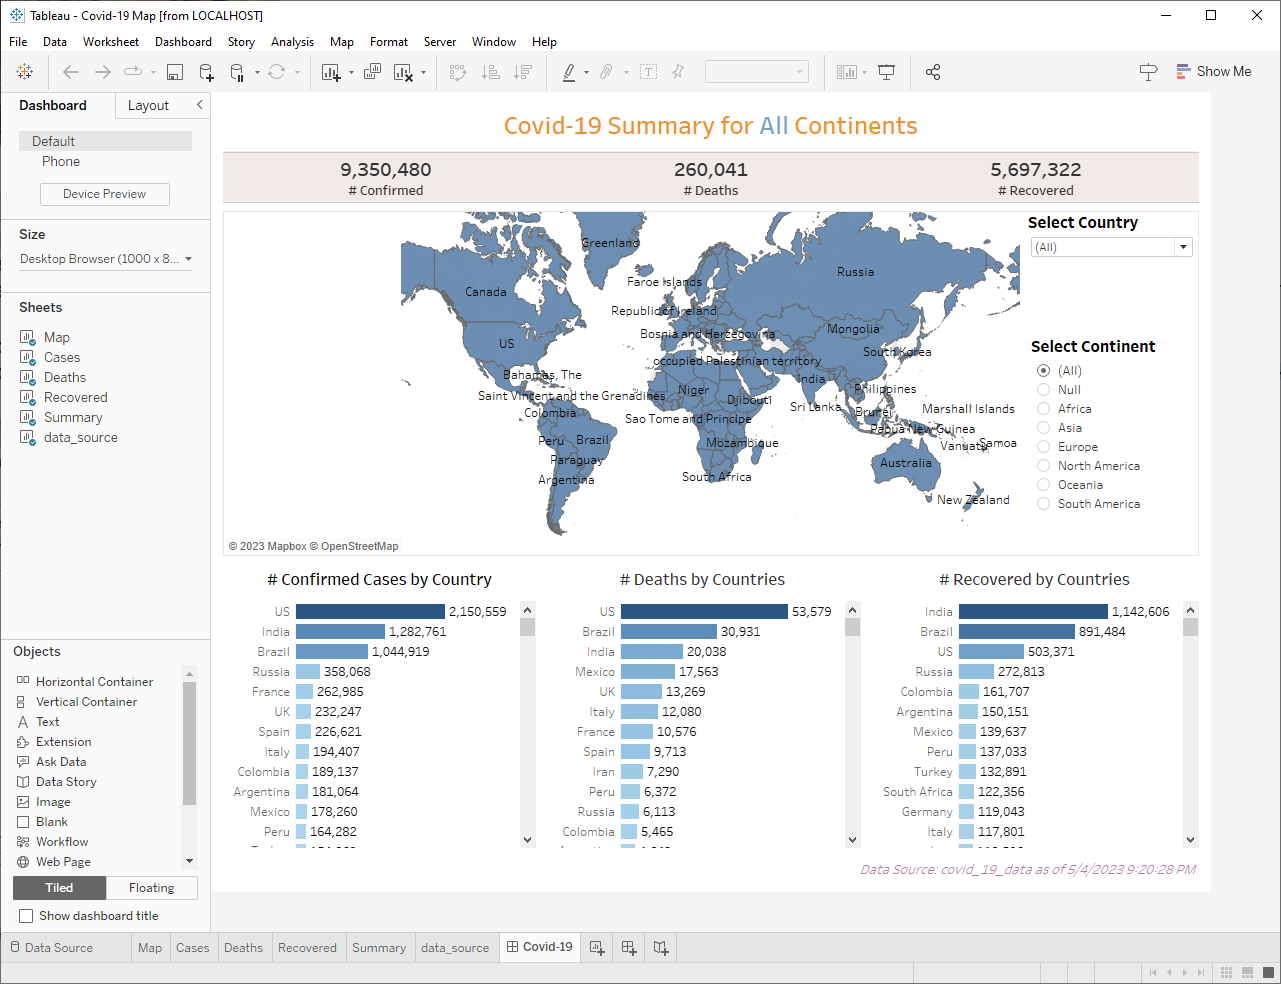
Building high-resolution, interactive dashboards in Tableau and PowerBI that turn complex data into actionable stories.

Tableau

Salesforce

Salesforce Certified: Expertise in implementation, administration, and CRM data architecture.

Selected Projects

Student Loan Debt Analysis

Helping the US Dept. of Education prioritize relief by identifying at-risk demographics and locational hot-spots.

Open full dashboard on Tableau Public ↗

Procurement Analysis

Developed a procurement dashboard for real-time spend analysis and vendor performance tracking.

Open full dashboard on Tableau Public ↗

Interests

Away from the dashboards, these are the things that keep me curious and keep me moving.

Design & Code

Planning and implementing innovative engineering ideas, including 3D printing and AI assistant development. I like problems I can build my way out of — from a soldered speaker enclosure to a working web app.

Physical Vitality

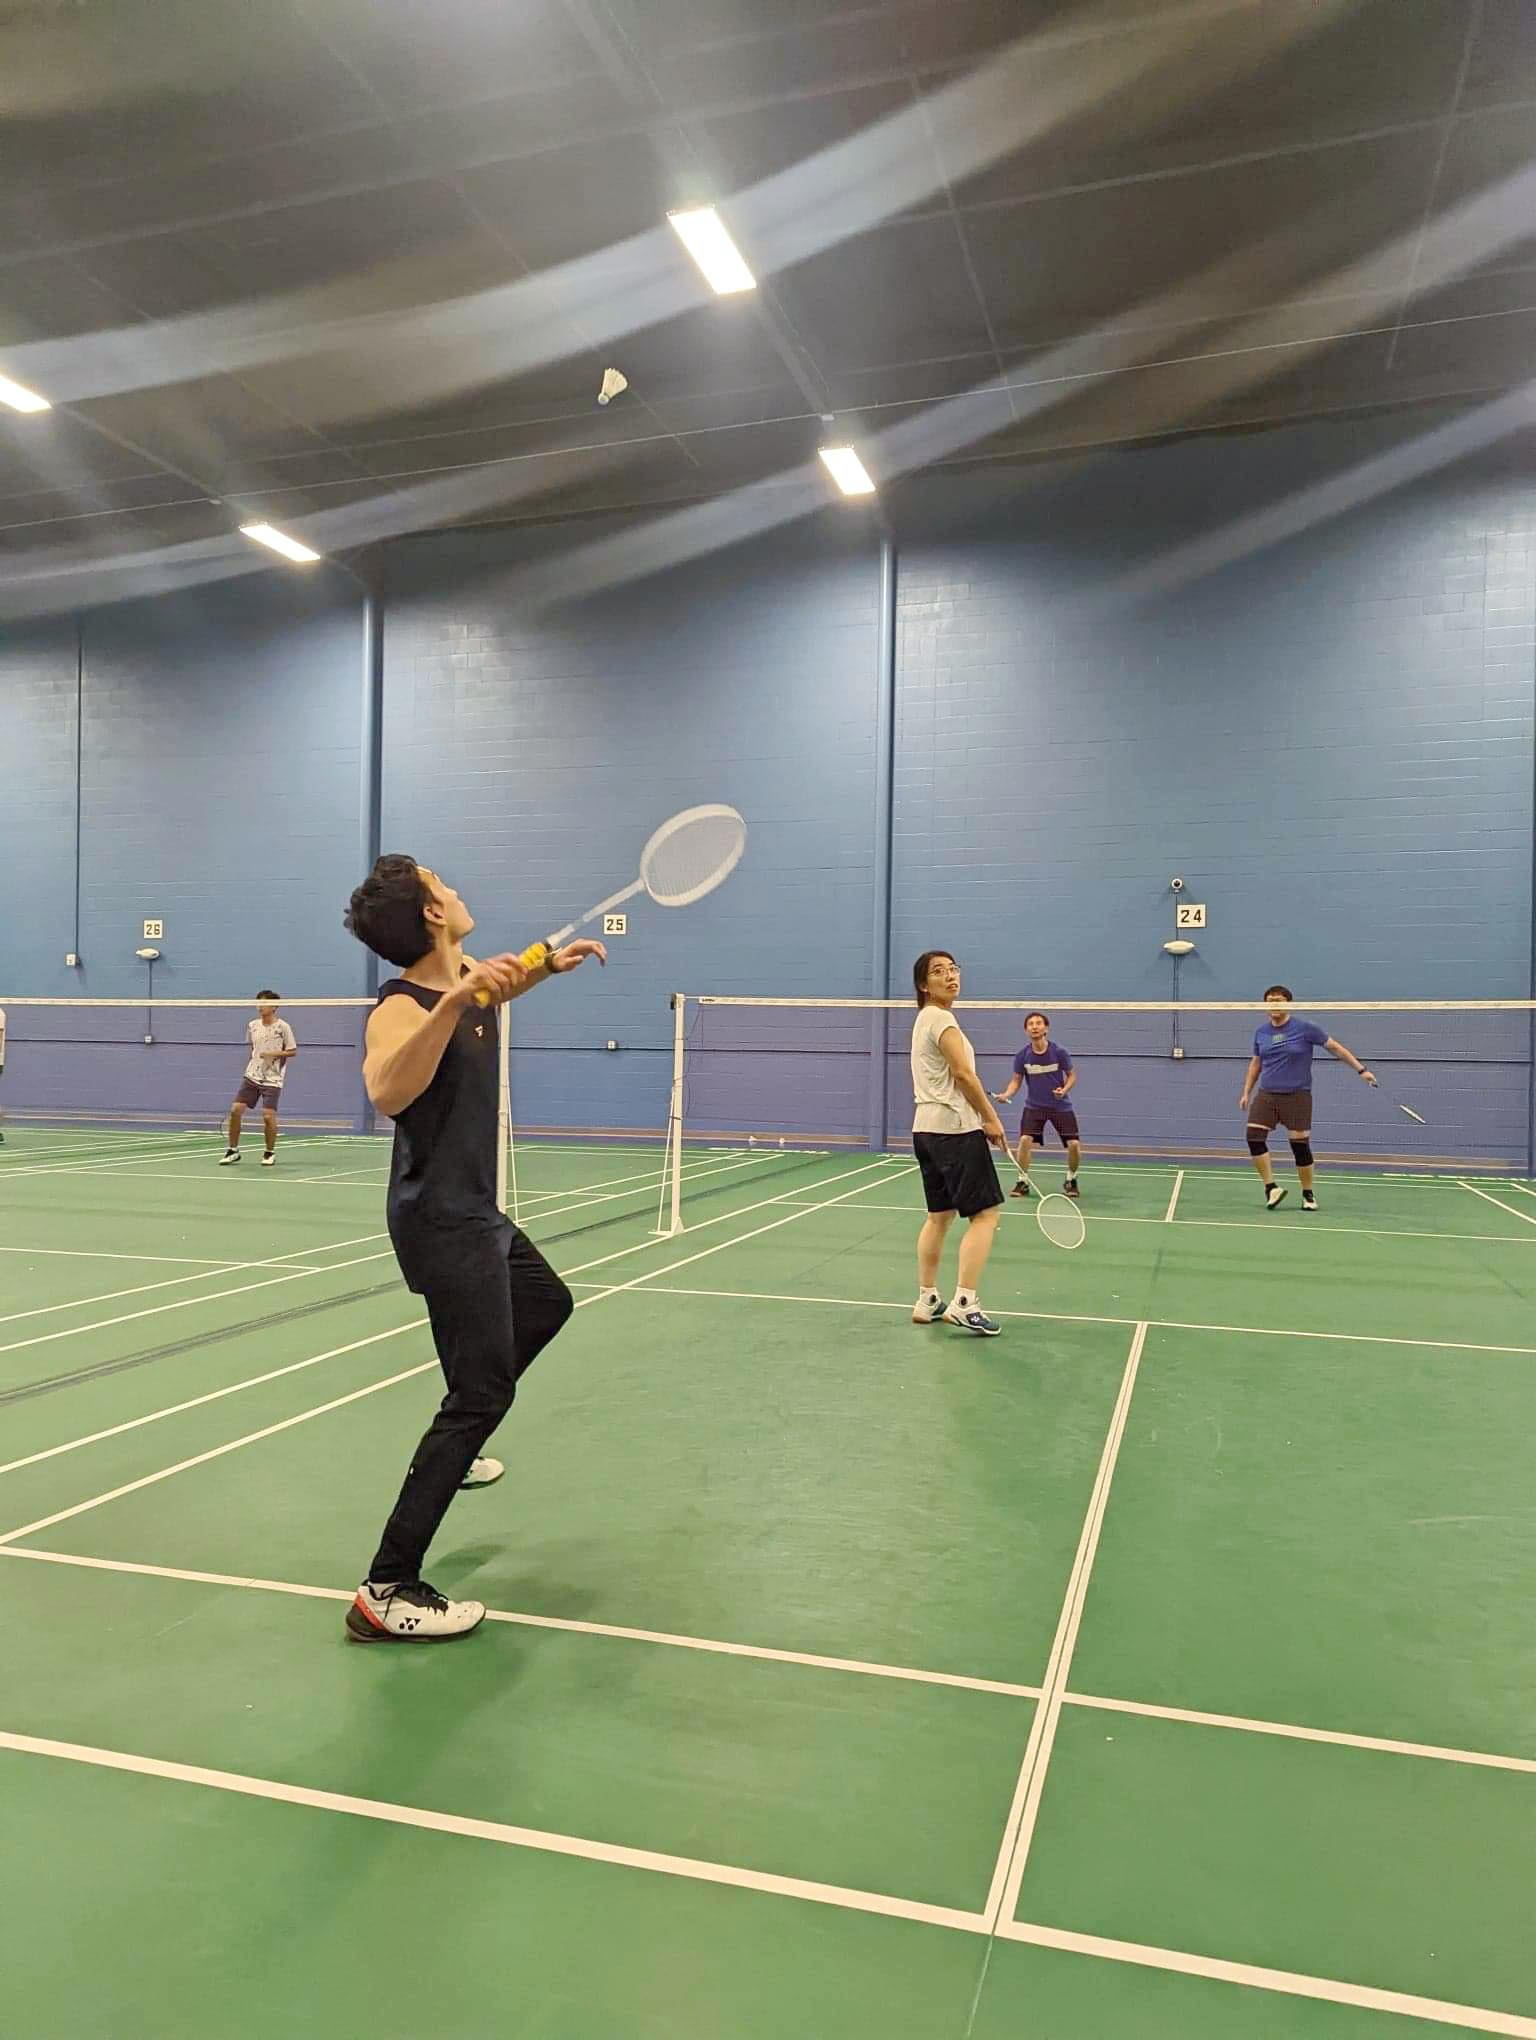
Staying active through bouldering, weightlifting, snowboarding, and kayaking. Staying physically active keeps me sharp for the analytical work and, more simply, makes life more fun.

Community

Data work is most meaningful to me when it reaches the people who need it most.

Giving Back to the Bay Area

At Second Harvest of Silicon Valley, I volunteered alongside a team that sorted 22,500 pounds of produce for families across the region — and applied data visualization and UX design to help streamline their processes and surface actionable insights.

I believe it's important to help those who are struggling to help themselves, and to create positive change while including everyone regardless of their background. Sometimes we have to be the change we wish to see.